Edit chart
Loading graph
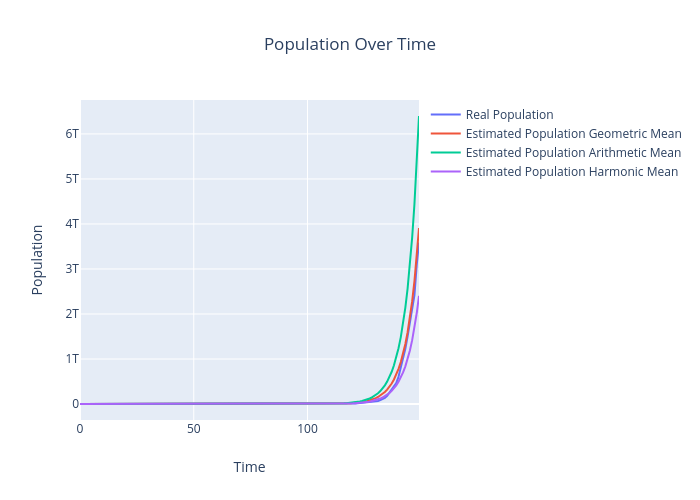
Aw1_mailinator's interactive graph and data of "Population Over Time" is a scatter chart, showing Real Population, Estimated Population Geometric Mean, Estimated Population Arithmetic Mean, Estimated Population Harmonic Mean; with Time in the x-axis and Population in the y-axis.. The x-axis shows values from 0 to 0. The y-axis shows values from 0 to 0.